Difference between revisions of "PT Import Content Dashboard Overview"
(→Mappings) |
|||
| Line 10: | Line 10: | ||
The status report blocks for mappings and build will show the percentage complete, pie chart, and numeric counts. The reports are calculating the numeric count fields of the total records to process, number of records processed, and then number of records to be processed. | The status report blocks for mappings and build will show the percentage complete, pie chart, and numeric counts. The reports are calculating the numeric count fields of the total records to process, number of records processed, and then number of records to be processed. | ||
| − | + | == Mappings == | |
In the Mappings status report block renders a button to "Create Job to Import Mappings". When selecting this button, this will open the Content Mapping Dashboard dialog. | In the Mappings status report block renders a button to "Create Job to Import Mappings". When selecting this button, this will open the Content Mapping Dashboard dialog. | ||
| Line 21: | Line 21: | ||
* Create Mappings for New Records = This process will create the new mapping custom element records based on the source mapping data records that have not been created. | * Create Mappings for New Records = This process will create the new mapping custom element records based on the source mapping data records that have not been created. | ||
| − | + | == Build == | |
| − | + | == Jobs == | |
Revision as of 18:26, 1 April 2011
Contents
Overview
PT Import Content dashboard page is the main user interface for the application. This dashboard is designed to provide an overview of each categories processing status and history.
The dashboard contains two columns with accordion menus. The main column, left column, contains menus for the four main categories (subsites, pages, documents, and images) and the fix links process. The side column, right column, contains menus for jobs, reports, settings, and tools menus.
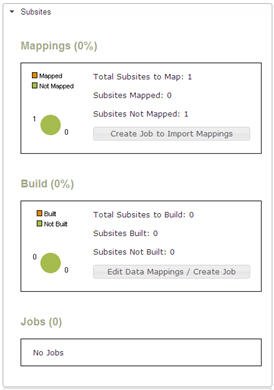
In the four main category menus contain 3 blocks of status reports for mappings, build (aka import), and jobs.
The status report blocks for mappings and build will show the percentage complete, pie chart, and numeric counts. The reports are calculating the numeric count fields of the total records to process, number of records processed, and then number of records to be processed.
Mappings
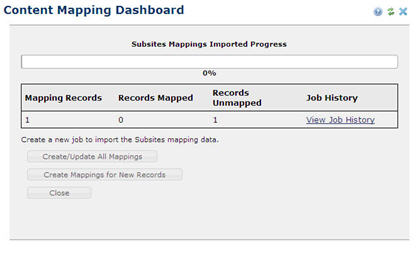
In the Mappings status report block renders a button to "Create Job to Import Mappings". When selecting this button, this will open the Content Mapping Dashboard dialog.
This dialog display the progress bar and details for the status of the mapping process.
The buttons allows for jobs to be created for two types of processing.
- Create/Update All Mappings = This process will create or update all the mapping custom element records based on the source mapping data records.
- Create Mappings for New Records = This process will create the new mapping custom element records based on the source mapping data records that have not been created.

