Difference between revisions of "PT Import Content Dashboard Overview"
(Created page with '== Overview == PT Import Content dashboard page is the main user interface for the application. This dashboard is designed to provide an overview of each categories processing s…') |
(→Overview) |
||
| Line 9: | Line 9: | ||
The status report blocks for mappings and build will show the percentage complete, pie chart, and numeric counts. The reports are calculating the numeric count fields of the total records to process, number of records processed, and then number of records to be processed. | The status report blocks for mappings and build will show the percentage complete, pie chart, and numeric counts. The reports are calculating the numeric count fields of the total records to process, number of records processed, and then number of records to be processed. | ||
| + | |||
| + | == Mappings == | ||
| + | |||
| + | |||
| + | |||
| + | == Build == | ||
| + | |||
| + | |||
| + | |||
| + | == Jobs == | ||
Revision as of 18:12, 1 April 2011
Contents
Overview
PT Import Content dashboard page is the main user interface for the application. This dashboard is designed to provide an overview of each categories processing status and history.
The dashboard contains two columns with accordion menus. The main column, left column, contains menus for the four main categories (subsites, pages, documents, and images) and the fix links process. The side column, right column, contains menus for jobs, reports, settings, and tools menus.
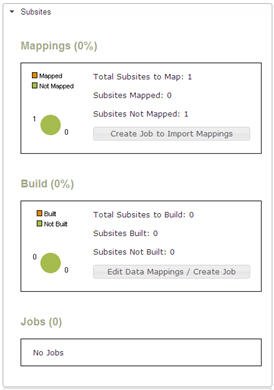
In the four main category menus contain 3 blocks of status reports for mappings, build (aka import), and jobs.
The status report blocks for mappings and build will show the percentage complete, pie chart, and numeric counts. The reports are calculating the numeric count fields of the total records to process, number of records processed, and then number of records to be processed.
